ECONOMIC ANALYSIS

I. PRINCIPAL ACCOUNTING AND VALUATION GUIDELINES

A. PRINCIPLE ACCOUNTING

The economic management of TATIANA is conducted according to the general principles of accounting as stated in the general plan of accounting, so that the Annual Accounts of the Association are produced in a well structured format reflecting a true comparison between the financial situation of the Company and its results.

In order to achieve this true comparison, explanations have been provided for those accounting principles which have been applied.

B. VALUATION / ESTIMATION PRINCIPLES

Fixed Assets: Plant and Equipment

As a general guideline, all goods are entered in the Associations balance sheet at their respective purchase or production costs, with donated goods being valued at their market or commercial value at the time of acquisition. The cost of additional or complimentary equipment for existing investments, are incorporated into the value of the corresponding fixed asset, therefore valuing the asset as described above.

With regards to depreciation, a deduction from the value of all fixed assets has been made. These deductions were determined systematically from the operational life span of the products, applying a level of depreciation created from every day use, but without providing for the possibility of obsolescence.

Fixed Assets: Furniture and Fittings

Entries under this heading are valued at their price of acquisition or similarly at their cost of production, applying those criteria established for valuing plant and equipment. Computer applications are only considered as a fixed asset in those cases when their cost will be reclaimed over various years. Included within these computer applications are those which have or have not been bought directly through the Association resources.

Industrial Property: collect the expenses of I+D that are fulfilled by the enterprise or the satisfied independent enterprise to obtain a Patent.

Financial Fixed Assets:

These negotiable values are generally valued at their acquisition, subscription or purchase price and include the total price paid and the costs necessary to carry out the operation.

Differences in Monetary Exchanges:

In order to perform international transactions of a commercial nature or distribute grants to students or staff located within Europe, it is often necessary to convert pesetas or other liquid assets of the Association into foreign currency. In such cases the level of exchange depends upon the exchange rate on the day the transaction is conducted. With regards to the individual projects subsidised by COMETT, a fixed exchange rate is used, as stated in the UETP's contract as established upon initiation of the Programme.

Capital subsidies:

Non refundable capital subsidies are valued at their total cost price. Non refundable capital subsidies are generally those which have not complied with the conditions established for their concession and those for which there is reasonable doubt about their future maturity.

II. MONETARY CONTRIBUTIONS IN 1995

A. INCOMING FUNDS

Incoming revenue of the Association is made up from contributions of either an economic or logistic nature. Generally speaking, economic contributions take the form of subsidies, annual fees from the Association's members, or in some cases contributions which arise from collaboration agreements between active members and TATIANA as illustrated in Table I.

The COMETT programme:

Under the auspices of the European COMETT programme, the TATIANA UETP receives subsidies for the realisation of specific projects namely; A (maintenance of the network); Ba (mobility of students); Bc (Exchange of Personnel); and finally strand Ca (organisation of training courses).

University of Oviedo:

The contribution from the University of Oviedo has been the provision and maintenance of the necessary infrastructure where the management of the Association and its projects are developed. Continuing with the criteria established in the last period, these contributions will be estimated at the same value. In addition, the University of Oviedo also contributes the services of the TATIANA Coordinator and Director.

Active Members:

Further financial support also comes from active partners, i.e. those paying an annual fee under the collaboration agreement between the said company or organisation and TATIANA. This contribution amounts to approximately 750 ECU, depending upon the rate of exchange when converting currencies.

Other Contributions:

Under this heading are those contributions which are awarded for conducting programmes or projects specifically designed to provide training e.g. support from the Ministry of Education and Science.

INCOMING FUNDS
ENTITYPESETAS
COMETT PROGRAMME A 7.356.636 Ca 2.180.242
European Social Fund3.300.000
Oviedo University (est)5.200.000
Active Members845.761
Loan Services449.763
Other contributions259.909
TOTAL19.592.311
B. FINANCIAL INCOMES

Financial revenue consists of those profits which are produced from the management of TATIANA's portfolio as well as return on investment as shown in Table II.

Also included within this concept are profits obtained from the purchase of government bonds issued by the State and profit from investment funds such as interest earned on deposits in a current account. These activities are conducted via the temporary depositing of money in the treasury, with the profits received from such actions being re-invested back into TATIANA.

FINANCIAL INCOMES
CONCEPTPESETAS
Financial Activity1.248.148
Interest Paid72.349
TOTAL1.320.497

III. EXPENSES

A. EUROPEAN SECTORAL NETWORK

Included within this area are those costs involved in the management of the Association, its diffusion and expansion - one of the fundamental objectives of the TATIANA UETP. Table III illustrates the types of expenses incurred and their weighting in comparison with total costs resulting from participating in TATIANA's three main areas of action.

CONCEPTPESETASPERCENTAGE
Personnel1.820.87110.32%
Diffusion of the Association1.109.5706.29%
Consumable Goods492.6652.79%
Auxiliary services505.6642.86%
Administration and other expenses1.785.86910.12%
TOTAL5.714.63932.41%
B. EXCHANGE OF STUDENTS AND PERSONNEL

Incorporated into this heading are the expenses involved in the conducting of student and personnel mobilities such as bank transfers and insurance policies which are taken out for individual exchanges, the proportions of which can be seen in Table IV.

TYPE OF GRANTPESETASPERCENTAGE
Student Exchanges9.044.98951.30%
Personnel Exchanges2.656.73115.06%
TOTAL9.795.56355.56%
C. TRAINING ACTIONS COORDINATED OR SUBSIDISED

These figures include all those costs incurred from carrying out training actions. They consider, amongst other items, travel of invited personnel, overheads, consumable goods and stock etc. Table V lists all such expenses incurred in each of the training actions conducted throughout the 1995 period.

TITLEPESETASPERCENTAGE
IV Congreso de la SIC471.0002.67%
XVII Reunion Bienal SEME332.0001.88%
Flow Cytometry156.000.88%
Nordic Stereology Course179.0001.01%
Introduction to Image Cytometry179.0001.01%
Stereology and Quantitative 3-D Microscopy473.4452.68%
Citopatologia y Citologia Analitica1.794.47310.17%
Digital Image Processing329.0001.86%
TOTAL2.119.44512.02%

IV. INVESTMENTS

The TATIANA network disposed of an infrastructure as soon as information equipment and audiovisuals, covering all the activities to be fulfilled, without losing efficiency in the process, were given. Nevertheless a few improvements of the capacity of the equipment may be fulfilled in order to achieve the quality to conduct the tasks with the utmost speed and efficiency. To detail the expenditure used to patent a multimedia product assigned to the formation of specialists in Cytometry.

The total cost of these investments can be found in Table VI along with a breakdown of the individual fixed assets acquired and their relative costs.

CONCEPTPESETAS
Computer Applications50.631
Computer Equipment153.343
Assets20.880
Audiovisual Equipment203.000
TOTAL INVESTMENT427.854
V. BALANCE SHEET

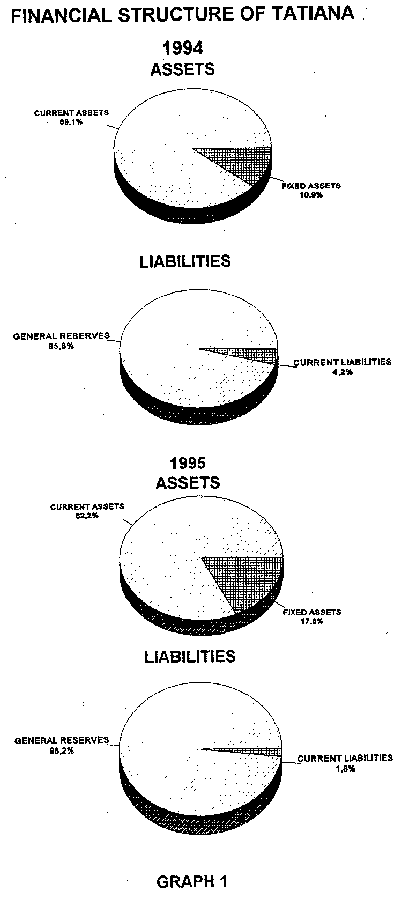
The purpose of the balance sheet is to facilitate comparisons between the financial position of the Association at a given time between one period and another. A comparison of the years 1994 and 1995 are presented in Table VII and are summarised in graph number 1, with the aim of illustrating the growth achieved in each area.

As is highlighted by the graphical illustrations, fixed assets represent a small proportion of total assets which shows that TATIANA is an Association which bases its activities in training projects and mobilities with fixed assets occupying a small part of these activities. On the other hand, the level of TATIANA's own funds indicate that the UETP is an Association with financial stability with a guaranteed solvency should the need arise.

It is important to note the small difference between the two final balances has occurred due to the level of investments carried out throughout the period.

BALANCE SHEET FOR THE 1995 PERIOD
19941995
CURRENT ASSETS
Fixed Assets2.467.4672.230.791
Fixed Assets - Intangible Assets198.512185.768
215 Computer Applications198.512249.143
212 Assets20.880
281 Acc. Depreciation on Plant and Equipment(22.408)(84.255)
Fixed Assets - Tangible Assets2.291.3632.045.023
226 Fixtures and Fittings1.361.8631.564.863
227 Computer Equipment1.542.5151.695.858
282 Acc. Depreciation on Plant and Equipment(613.015)(1.215.698)
CURRENT ASSETS20.276.34711.375.906
Debtors131.863149.370
470 Public Finance Debts131.863131.279
473 Deduction and Payment on Account18.091
Short Term Financial Investment17.952.7849.154.057
541 Fixed Yield Securities17.937.1049.000.000
546 Short Term Interest on Fixed Yield Securities15.680154.057
Treasury2.192.2842.072.479
570 Cash Box - Pesetas251.309558.919
571 Cash Box - Foreign Currency75.61975.619
572 Bank Account - Pesetas1.865.3561.437.941
TOTAL ASSETS22.743.81413.606.697
CURRENT LIABILITIES
DEPOSITS TO DISTRIBUTE IN VARIOUS YEARS21.790.90913.362.879
Deposits to Distribute in Various Years21.790.90913.362.879
131 Capital Subsidies21.790.90913.362.879
SHORT TERM CREDITORS952.905243.818
Commercial Creditors750.000
410 Creditors - Payment of Services750.000
Other Non-commercial Debts202.905243.818
465 Outstanding Payments109.949127.303
475 Public Finance Creditors for Fiscal Concepts30.84348.002
476 Social Security48.96368.513
521 Short Term Debts13.1500
TOTAL LIABILITIES22.766.22213.606.697

VI. PROFIT AND LOSS ACCOUNT

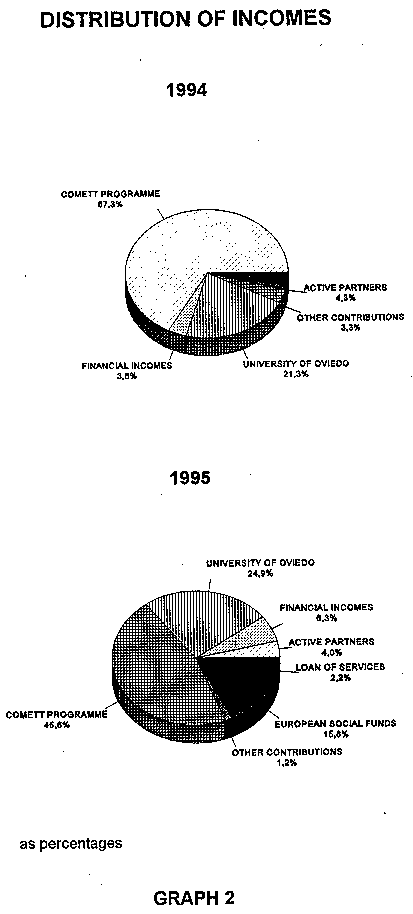
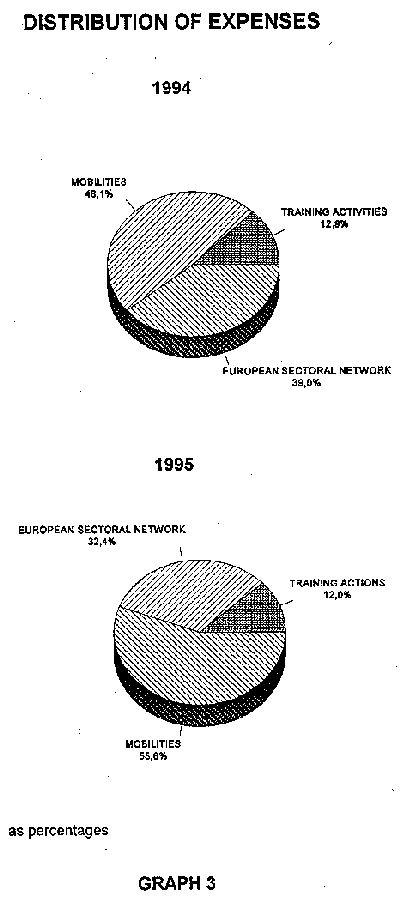
The profit and loss account is made up from those incoming and outgoing which summarise the functioning and development of the TATIANA UETP. The figures for the 1995 period can be seen in Table VIII and graphs number 2 and 3, displaying total costs for each concept and its overall percentage.

This profit and loss account has a staggered structure in such that it allows entries to be followed through their economic movement to arrive at the final profit to loss figure for the Association. The ratios show the total cost of each entry in relation to total income received. The horizontal ratio represented by "percentage 94-95" illustrates the progression of each entry during the year. The figures also show how there has been an important increase in the level of expenses and income received for operational procedures, consistent with the data shown in other graphs and tables presented.

PROFIT AND LOSS ACCOUNT
CONCEPT19941995% Est.94%Est.95% 94-95
RECEIPTS FOR OPERATION OPERATING COSTS23.464.93325.854.275100%100%110%
Personnel Costs(11.724.610)(13.735.719)50%53.12%117%
Professional services:
Independent(4.269.000)(5.624.660)18.2%21.75%131%
Contracted services(5.160.777)(4.213.031)22%16.29%81%
Repairs and conversation --------(56.270)--------0.21%--------
Taxes--------(119.360)--------0.46%--------
OPERATING MARGIN2.310.5462.105.2359.8%8.14%91%
Deportation on fixed assets(357.761)(664.530)1.52%2.57%185%
Operational Costs(2.500.000)(2.500.000)10.65%9.66%100%
OPERATIONAL RESULTS(547.215)(1.059.295)2.3%4%193%
Diffusion costs(203.067)(57.936)0.6%0.2%28%
COMMERCIAL MARGIN(750.282)(1.117.231)3.19%4.3%149%
Financial Costs
Banking services and similar(133.782)(124.422)0.36%0.48%93%
Taxes on capital investment94.38472.3491%0.27%76%
Taxes on fixed yield securities815.2181.248.1484.8%4.8%153%
Other financial expenses--------(362.042)--------1.4%--------
BENEFICIAL ORDINARY ACTIVITIES25.538(283.198)0.1%1%-110%
Extraordinary results4.182283.1990.97%1%671%
Extraordinary costs(29.720)(1)0.1%----------------
PRE TAX RESULTS000%----------------
Tax on earnings
NET RESULT----------------------------------------

VII. FINANCIAL ECONOMIC INDICATORS

With the aim of providing further information on the financial economic content, a series of ratios have been produced which show important aspects such as the Associations financial position, the profit earned and the solvency of the Association both in the long and short term.

Unfortunately, a perfect ratio does not exist in order to measure these points of reference since the type of ratio depends both upon the sector in which the organisation is based and the type of activities undertaken. In the case of TATIANA, the ratios determined in 1994 will be used as a base therefore diminishing the core difficulty of interpreting stock which constitutes a large part of the profits.

The majority of these indicators for 1994 can be seen in Table IX.

SELECTED FINANCIAL FIGURES
19941995
Income received for operations24.356.30924.457.971
Operational costs23.887.17422.093.946
Financial expenses93.200486.464
Depreciation(357.761)(664.530)
Benefits before taxes (BAIT)00
Net profit00
Cash - Net flow357.761664.530
TATIANA resources21.790.90913.362.879
Fiscal debt79.806116.515
Investment1.084.114427.854
FINANCIAL ECONOMI INDICATORS (%)
Operating margin (1)1.9219.53
Financial expenses/operating costs (2).38261.77
Profit on net fixed assets - Plant & Equipment (3)25.53234
Insurance for fixed assets (4)876.08541.5
Guarantee ration (5)95.8198.2
Degree of self-financing (6)95.8198.2
Degree of financial dependence (7)4.181.79
Fixed asset financing coefficient (8)876.08541.5
Liquid asset financing coefficient (9)4.682.14
Solvency ratio (10)2.389.135.580
Treasury ratio (11)2.1794.604
Liquidity (12)89.0682.50

Home Page Table of Contents Sponsors Web Sites
CD ROM Vol 2 was produced by staff at the Purdue University Cytometry Laboratories and distributed free of charge as an educational service to the cytometry community. If you have any comments please direct them to Dr. J. Paul Robinson, Professor & Director, PUCL, Purdue University, West Lafayette, IN 47907. Phone:(317) 494-0757; FAX (317) 494-0517; Web http://www.cyto.purdue.edu EMAIL robinson@flowcyt.cyto.purdue.edu